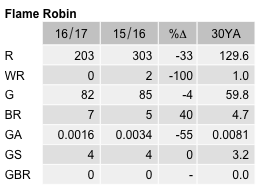
Flame Robin
Petroica phoenicea
ABR description
The following is extracted from the Annual Bird Report for the twelve months to June 2017.
Uncommon, breeding resident/altitudinal migrant
An altitudinal migrant reported less in summer. Declared vulnerable in NSW.
General: The reporting rate (1.5%) is the lowest it has been since 1997 (1.3%), the lowest value since records were kept. It is down 52% on the 10YA and 69% on the 30YA. Total number of birds sighted (770) is just over half that of last year. The average number of birds per record (3.8) is, however, slightly up on the long-term averages. The seasonal distribution of records differs from the 30YA, in that winter records are higher (42% cf 31%) and spring records lower (17% cf 30%). Breeding - 7 records: earliest cf/29 Oct Cotter Hut Rd GrD21 (AlB1) and latest, dy/9 Dec Mt Aggie GrC18 (CaR3).
GBS: 4 records from 3 suburban and 1 rural site in winter (500%) and autumn (50%) only in 8 weeks of the year. Records from Bonner (GrB1), Curtin (AJR1), Carwoola (BuM1)) and Narrabundah (PaR9). Only a single record from each site. No breeding recorded.
Abundance
Abundance is the average number of birds of that species per survey. Where the species was observed (presence recorded) but the number of birds seen was not recorded, this is treated as a count of zero.
Abundance by year
This chart shows the abundance of Flame Robin between 1982 and 2017. 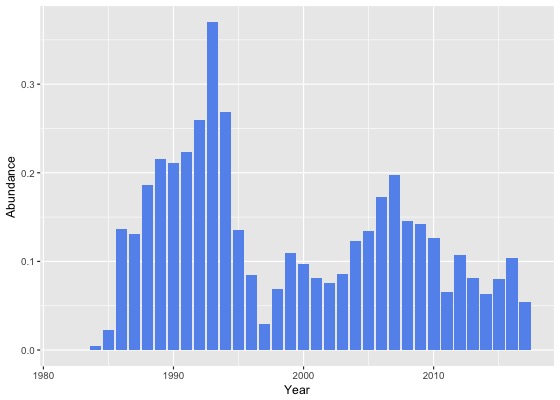
Abundance by month
This chart shows the monthly abundance of Flame Robin. The blue lines show the abundance for the twelve months to June 2017 and the bars show the average abundance for the period 1982 to 2017. 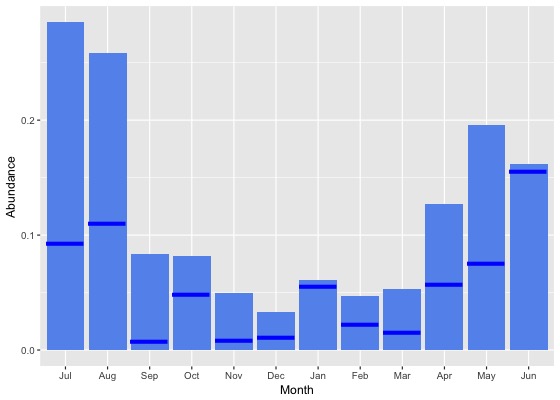
Abundance by season
This chart shows the seasonal abundance of Flame Robin. The blue lines show the seasonal abundance for the twelve months to June 2017 and the bars show the average seasonal abundance for the period 1982 to 2017. 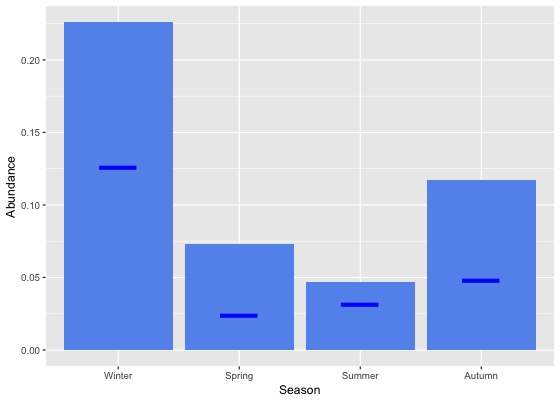
Abundance data
| Month | Season | ||||||||||||||||||
|---|---|---|---|---|---|---|---|---|---|---|---|---|---|---|---|---|---|---|---|
| Period | Jul | Aug | Sep | Oct | Nov | Dec | Jan | Feb | Mar | Apr | May | Jun | Winter | Spring | Summer | Autumn | All | ||
| All years | |||||||||||||||||||
| All | 0.3 | 0.3 | 0.1 | 0.1 | 0.0 | 0.0 | 0.1 | 0.0 | 0.1 | 0.1 | 0.2 | 0.2 | 0.2 | 0.1 | 0.0 | 0.1 | 0.1 | ||
| Previous years | |||||||||||||||||||
| All previous years | 0.3 | 0.3 | 0.1 | 0.1 | 0.1 | 0.0 | 0.1 | 0.1 | 0.1 | 0.1 | 0.2 | 0.2 | 0.2 | 0.1 | 0.0 | 0.1 | 0.1 | ||
| Previous 30 years | 0.3 | 0.3 | 0.1 | 0.1 | 0.1 | 0.0 | 0.1 | 0.1 | 0.1 | 0.1 | 0.2 | 0.2 | 0.2 | 0.1 | 0.1 | 0.1 | 0.1 | ||
| Previous 20 years | 0.3 | 0.3 | 0.1 | 0.1 | 0.0 | 0.0 | 0.1 | 0.0 | 0.0 | 0.1 | 0.2 | 0.2 | 0.2 | 0.1 | 0.0 | 0.1 | 0.1 | ||
| 10 year groups | |||||||||||||||||||
| [2007,2017) | 0.4 | 0.3 | 0.1 | 0.1 | 0.0 | 0.0 | 0.0 | 0.0 | 0.0 | 0.1 | 0.2 | 0.2 | 0.3 | 0.1 | 0.0 | 0.1 | 0.1 | ||
| [1997,2007) | 0.3 | 0.3 | 0.1 | 0.1 | 0.1 | 0.0 | 0.1 | 0.0 | 0.0 | 0.1 | 0.2 | 0.1 | 0.2 | 0.1 | 0.1 | 0.1 | 0.1 | ||
| [1987,1997) | 0.2 | 0.3 | 0.3 | 0.2 | 0.1 | 0.1 | 0.1 | 0.1 | 0.2 | 0.3 | 0.2 | 0.2 | 0.3 | 0.2 | 0.1 | 0.2 | 0.2 | ||
| 5 year groups | |||||||||||||||||||
| [2012,2017) | 0.3 | 0.3 | 0.1 | 0.1 | 0.0 | 0.0 | 0.0 | 0.0 | 0.0 | 0.1 | 0.2 | 0.1 | 0.2 | 0.0 | 0.0 | 0.1 | 0.1 | ||
| [2007,2012) | 0.4 | 0.2 | 0.0 | 0.1 | 0.0 | 0.0 | 0.1 | 0.1 | 0.1 | 0.2 | 0.4 | 0.2 | 0.3 | 0.1 | 0.1 | 0.2 | 0.1 | ||
| [2002,2007) | 0.3 | 0.4 | 0.0 | 0.1 | 0.1 | 0.0 | 0.1 | 0.1 | 0.1 | 0.1 | 0.2 | 0.1 | 0.3 | 0.1 | 0.1 | 0.1 | 0.1 | ||
| [1997,2002) | 0.2 | 0.1 | 0.1 | 0.0 | 0.1 | 0.1 | 0.1 | 0.0 | 0.0 | 0.1 | 0.2 | 0.1 | 0.1 | 0.1 | 0.0 | 0.1 | 0.1 | ||
| [1992,1997) | 0.4 | 0.4 | 0.4 | 0.1 | 0.1 | 0.0 | 0.1 | 0.1 | 0.2 | 0.3 | 0.2 | 0.2 | 0.3 | 0.2 | 0.1 | 0.2 | 0.2 | ||
| [1987,1992) | 0.2 | 0.3 | 0.2 | 0.2 | 0.2 | 0.2 | 0.2 | 0.1 | 0.2 | 0.2 | 0.2 | 0.2 | 0.2 | 0.2 | 0.1 | 0.2 | 0.2 | ||
| Year | |||||||||||||||||||
| 2017 | 0.1 | 0.1 | 0.0 | 0.0 | 0.0 | 0.0 | 0.1 | 0.0 | 0.0 | 0.1 | 0.1 | 0.2 | 0.1 | 0.0 | 0.0 | 0.0 | 0.1 | ||
| 2016 | 0.5 | 0.4 | 0.1 | 0.0 | 0.0 | 0.0 | 0.0 | 0.0 | 0.0 | 0.1 | 0.2 | 0.1 | 0.3 | 0.0 | 0.0 | 0.1 | 0.1 | ||
| 2015 | 0.2 | 0.3 | 0.0 | 0.0 | 0.0 | 0.0 | 0.0 | 0.0 | 0.1 | 0.1 | 0.2 | 0.2 | 0.2 | 0.0 | 0.0 | 0.1 | 0.1 | ||
| 2014 | 0.2 | 0.1 | 0.0 | 0.1 | 0.0 | 0.1 | 0.1 | 0.0 | 0.0 | 0.1 | 0.1 | 0.0 | 0.1 | 0.0 | 0.0 | 0.1 | 0.1 | ||
| 2013 | 0.3 | 0.4 | 0.1 | 0.1 | 0.0 | 0.0 | 0.0 | 0.0 | 0.0 | 0.1 | 0.2 | 0.2 | 0.3 | 0.0 | 0.0 | 0.1 | 0.1 | ||
| 2012 | 0.3 | 0.2 | 0.0 | 0.1 | 0.1 | 0.0 | 0.0 | 0.1 | 0.0 | 0.1 | 0.3 | 0.2 | 0.2 | 0.1 | 0.1 | 0.1 | 0.1 | ||
| 2011 | 0.3 | 0.1 | 0.0 | 0.1 | 0.0 | 0.0 | 0.0 | 0.0 | 0.1 | 0.1 | 0.1 | 0.1 | 0.1 | 0.1 | 0.0 | 0.1 | 0.1 | ||
| 2010 | 0.9 | 0.2 | 0.0 | 0.1 | 0.0 | 0.0 | 0.0 | 0.0 | 0.1 | 0.1 | 0.4 | 0.2 | 0.3 | 0.1 | 0.0 | 0.2 | 0.1 | ||
| 2009 | 0.2 | 0.5 | 0.1 | 0.1 | 0.0 | 0.0 | 0.0 | 0.3 | 0.1 | 0.2 | 0.4 | 0.2 | 0.3 | 0.1 | 0.1 | 0.2 | 0.1 | ||
| 2008 | 0.5 | 0.3 | 0.0 | 0.2 | 0.0 | 0.0 | 0.1 | 0.3 | 0.0 | 0.1 | 0.2 | 0.2 | 0.3 | 0.1 | 0.1 | 0.1 | 0.1 | ||
| 2007 | 0.3 | 0.1 | 0.0 | 0.1 | 0.0 | 0.0 | 0.1 | 0.1 | 0.0 | 0.3 | 1.0 | 0.5 | 0.4 | 0.1 | 0.1 | 0.3 | 0.2 | ||
| 2006 | 0.7 | 0.6 | 0.1 | 0.1 | 0.1 | 0.0 | 0.2 | 0.3 | 0.2 | 0.1 | 0.1 | 0.0 | 0.4 | 0.1 | 0.1 | 0.1 | 0.2 | ||
| 2005 | 0.2 | 0.6 | 0.0 | 0.0 | 0.1 | 0.0 | 0.2 | 0.1 | 0.0 | 0.0 | 0.3 | 0.3 | 0.3 | 0.0 | 0.1 | 0.1 | 0.1 | ||
| 2004 | 0.3 | 0.3 | 0.0 | 0.2 | 0.1 | 0.0 | 0.1 | 0.1 | 0.0 | 0.1 | 0.3 | 0.0 | 0.2 | 0.1 | 0.0 | 0.1 | 0.1 | ||
| 2003 | 0.3 | 0.5 | 0.1 | 0.0 | 0.0 | 0.0 | 0.0 | 0.0 | 0.0 | 0.1 | 0.1 | 0.1 | 0.3 | 0.0 | 0.0 | 0.1 | 0.1 | ||
| 2002 | 0.2 | 0.1 | 0.0 | 0.1 | 0.1 | 0.0 | 0.0 | 0.0 | 0.0 | 0.2 | 0.3 | 0.1 | 0.1 | 0.1 | 0.0 | 0.1 | 0.1 | ||
| 2001 | 0.2 | 0.2 | 0.0 | 0.1 | 0.0 | 0.0 | 0.0 | 0.0 | 0.0 | 0.1 | 0.4 | 0.0 | 0.1 | 0.0 | 0.0 | 0.1 | 0.1 | ||
| 2000 | 0.3 | 0.0 | 0.3 | 0.0 | 0.1 | 0.0 | 0.0 | 0.0 | 0.0 | 0.1 | 0.2 | 0.3 | 0.2 | 0.1 | 0.0 | 0.1 | 0.1 | ||
| 1999 | 0.9 | 0.2 | 0.1 | 0.1 | 0.1 | 0.0 | 0.3 | 0.0 | 0.0 | 0.2 | 0.1 | 0.0 | 0.2 | 0.1 | 0.1 | 0.1 | 0.1 | ||
| 1998 | 0.0 | 0.1 | 0.0 | 0.1 | 0.1 | 0.2 | 0.1 | 0.1 | 0.0 | 0.0 | 0.0 | 0.0 | 0.1 | 0.1 | 0.1 | 0.0 | 0.1 | ||
| 1997 | 0.0 | 0.2 | 0.0 | 0.1 | 0.0 | 0.0 | 0.0 | 0.0 | 0.0 | 0.0 | 0.0 | 0.0 | 0.0 | 0.0 | 0.0 | 0.0 | 0.0 | ||
| 1996 | 0.1 | 0.2 | 0.1 | 0.0 | 0.0 | 0.0 | 0.1 | 0.1 | 0.1 | 0.1 | 0.3 | 0.0 | 0.1 | 0.0 | 0.1 | 0.2 | 0.1 | ||
| 1995 | 0.3 | 0.3 | 0.0 | 0.1 | 0.2 | 0.0 | 0.0 | 0.0 | 0.1 | 0.2 | 0.1 | 0.1 | 0.2 | 0.1 | 0.0 | 0.2 | 0.1 | ||
| 1994 | 0.7 | 1.1 | 0.2 | 0.0 | 0.0 | 0.0 | 0.1 | 0.1 | 0.2 | 0.4 | 0.1 | 0.5 | 0.7 | 0.1 | 0.1 | 0.3 | 0.3 | ||
| 1993 | 0.5 | 0.2 | 1.9 | 0.1 | 0.1 | 0.0 | 0.3 | 0.0 | 0.8 | 0.0 | 0.0 | 0.3 | 0.3 | 0.6 | 0.1 | 0.3 | 0.4 | ||
| 1992 | 0.7 | 0.1 | 0.2 | 0.4 | 0.1 | 0.0 | 0.1 | 0.3 | 0.1 | 0.8 | 0.2 | 0.0 | 0.3 | 0.3 | 0.1 | 0.3 | 0.3 | ||
| 1991 | 0.0 | 0.3 | 0.1 | 0.1 | 0.3 | 0.1 | 0.3 | 0.0 | 0.2 | 0.6 | 0.5 | 0.5 | 0.2 | 0.2 | 0.1 | 0.4 | 0.2 | ||
| 1990 | 0.2 | 0.3 | 0.3 | 0.0 | 0.1 | 0.1 | 0.1 | 0.0 | 0.0 | 0.4 | 0.4 | 0.5 | 0.3 | 0.1 | 0.1 | 0.2 | 0.2 | ||
| 1989 | 0.2 | 0.3 | 0.3 | 0.3 | 0.2 | 0.3 | 0.2 | 0.1 | 0.1 | 0.2 | 0.2 | 0.2 | 0.2 | 0.3 | 0.2 | 0.2 | 0.2 | ||
| 1988 | 0.1 | 0.3 | 0.2 | 0.2 | 0.2 | 0.2 | 0.2 | 0.1 | 0.2 | 0.2 | 0.1 | 0.2 | 0.2 | 0.2 | 0.1 | 0.2 | 0.2 | ||
| 1987 | 0.2 | 0.1 | 0.2 | 0.1 | 0.2 | 0.1 | 0.1 | 0.0 | 0.1 | 0.1 | 0.2 | 0.2 | 0.1 | 0.1 | 0.1 | 0.2 | 0.1 | ||
| 1986 | 0.3 | 0.2 | 0.2 | 0.1 | 0.1 | 0.1 | 0.0 | 0.0 | 0.0 | 0.0 | 0.3 | 0.4 | 0.3 | 0.1 | 0.0 | 0.1 | 0.1 | ||
| 1985 | 0.1 | 0.0 | 0.0 | 0.0 | 0.0 | 0.0 | 0.0 | 0.0 | 0.0 | 0.0 | 0.5 | 0.0 | 0.0 | 0.0 | 0.0 | 0.1 | 0.0 | ||
| 1984 | 0.0 | 0.0 | 0.0 | 0.0 | 0.0 | 0.0 | 0.0 | 0.0 | 0.0 | 0.0 | 0.0 | 0.0 | 0.0 | 0.0 | 0.0 | 0.0 | 0.0 | ||
| 1983 | 0.0 | 0.0 | 0.0 | 0.0 | 0.0 | 0.0 | 0.0 | 0.0 | 0.0 | - | 0.0 | 0.0 | 0.0 | 0.0 | 0.0 | 0.0 | 0.0 | ||
| 1982 | - | 0.0 | - | 0.0 | 0.0 | 0.0 | - | 0.0 | - | 0.0 | - | 0.0 | 0.0 | 0.0 | 0.0 | 0.0 | 0.0 | ||
Reporting rates
Reporting rate is the proportion of all surveys in which the species was present.
Reporting rate by year
This chart shows the reporting rate of Flame Robin each year between 1982 and 2017. 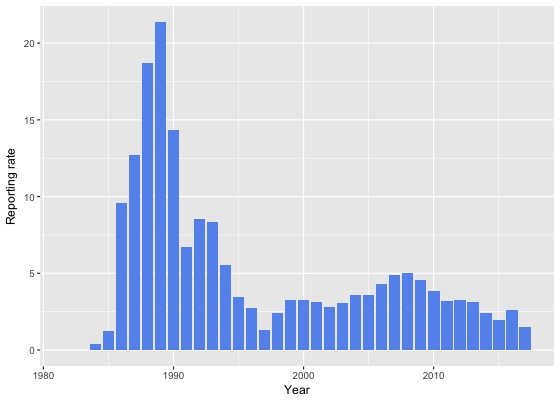
Reporting rate by month
This chart shows the reporting rate by month of Flame Robin. The blue lines show the reporting rate for the twelve months to June 2017 and the bars show the average reporting rate for the period 1982 to 2017. 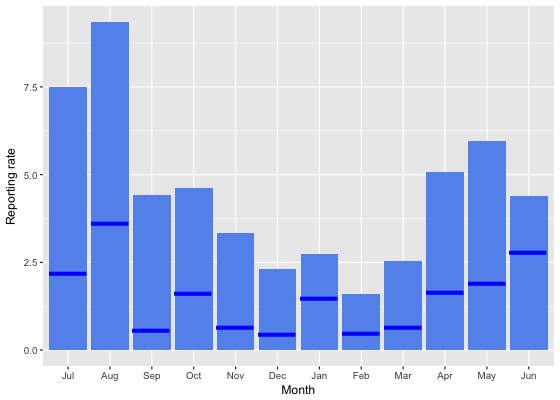
Reporting rate by season
This chart shows the seasonal reporting rate of Flame Robin. The blue lines show the seasonal reporting rate for the twelve months to June 2017 and the bars show the average seasonal reporting rate for the period 1982 to 2017. 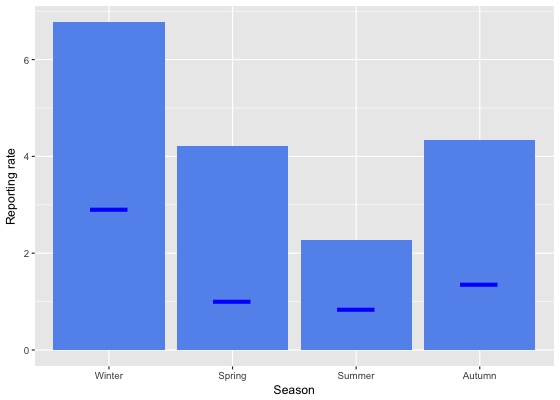
Reporting rate data
| Month | Season | ||||||||||||||||||
|---|---|---|---|---|---|---|---|---|---|---|---|---|---|---|---|---|---|---|---|
| Period | Jul | Aug | Sep | Oct | Nov | Dec | Jan | Feb | Mar | Apr | May | Jun | Winter | Spring | Summer | Autumn | All | ||
| All years | |||||||||||||||||||
| All | 7.5 | 9.3 | 4.4 | 4.6 | 3.3 | 2.3 | 2.7 | 1.6 | 2.5 | 5.1 | 6.0 | 4.4 | 6.8 | 4.2 | 2.3 | 4.3 | 4.3 | ||
| Previous years | |||||||||||||||||||
| All previous years | 8.3 | 10.4 | 4.9 | 5.0 | 3.8 | 2.6 | 3.0 | 1.8 | 2.9 | 5.6 | 6.9 | 4.7 | 7.5 | 4.7 | 2.5 | 4.9 | 4.7 | ||
| Previous 30 years | 8.3 | 10.5 | 4.9 | 5.1 | 3.8 | 2.6 | 3.0 | 1.9 | 2.9 | 5.7 | 6.8 | 4.6 | 7.5 | 4.7 | 2.5 | 4.9 | 4.8 | ||
| Previous 20 years | 6.9 | 7.5 | 2.5 | 3.8 | 1.6 | 1.1 | 1.7 | 1.2 | 1.5 | 3.9 | 5.5 | 3.5 | 5.6 | 2.8 | 1.4 | 3.4 | 3.1 | ||
| 10 year groups | |||||||||||||||||||
| [2007,2017) | 7.4 | 8.0 | 2.3 | 3.7 | 1.0 | 0.9 | 1.6 | 1.2 | 1.5 | 3.9 | 5.3 | 3.7 | 5.9 | 2.7 | 1.3 | 3.3 | 3.1 | ||
| [1997,2007) | 5.9 | 6.4 | 2.7 | 4.3 | 2.9 | 1.6 | 2.0 | 1.0 | 1.7 | 4.0 | 5.8 | 3.0 | 4.8 | 3.3 | 1.6 | 3.4 | 3.2 | ||
| [1987,1997) | 13.5 | 19.5 | 17.6 | 12.5 | 11.0 | 11.1 | 10.3 | 5.3 | 10.6 | 14.7 | 12.0 | 10.5 | 14.7 | 13.5 | 9.0 | 12.5 | 12.5 | ||
| 5 year groups | |||||||||||||||||||
| [2012,2017) | 6.9 | 7.9 | 2.6 | 2.6 | 0.5 | 0.6 | 1.3 | 0.8 | 1.2 | 3.1 | 4.4 | 3.1 | 5.7 | 2.1 | 1.0 | 2.7 | 2.6 | ||
| [2007,2012) | 9.1 | 8.4 | 1.7 | 5.6 | 2.2 | 1.4 | 2.7 | 2.9 | 2.2 | 5.8 | 7.8 | 4.7 | 6.6 | 3.9 | 2.2 | 4.9 | 4.2 | ||
| [2002,2007) | 7.3 | 7.9 | 2.6 | 4.8 | 2.5 | 1.0 | 1.8 | 1.4 | 1.5 | 4.1 | 6.6 | 3.3 | 5.8 | 3.4 | 1.3 | 3.5 | 3.5 | ||
| [1997,2002) | 3.5 | 4.6 | 2.8 | 3.7 | 3.2 | 2.3 | 2.3 | 0.6 | 1.9 | 3.9 | 4.9 | 2.7 | 3.5 | 3.2 | 1.8 | 3.3 | 2.9 | ||
| [1992,1997) | 8.9 | 6.7 | 8.4 | 4.3 | 3.7 | 1.8 | 4.3 | 3.2 | 5.0 | 7.3 | 6.2 | 3.8 | 6.3 | 5.2 | 3.2 | 6.2 | 5.3 | ||
| [1987,1992) | 15.5 | 26.4 | 22.0 | 17.1 | 14.5 | 15.2 | 13.5 | 6.0 | 13.9 | 18.9 | 15.0 | 14.3 | 19.1 | 17.6 | 11.7 | 16.0 | 16.2 | ||
| Year | |||||||||||||||||||
| 2017 | 2.2 | 3.6 | 0.6 | 1.6 | 0.7 | 0.4 | 1.5 | 0.5 | 0.6 | 1.6 | 1.9 | 2.8 | 2.9 | 1.0 | 0.8 | 1.4 | 1.5 | ||
| 2016 | 8.3 | 8.5 | 3.8 | 1.3 | 0.0 | 0.5 | 1.0 | 1.2 | 1.2 | 2.7 | 3.5 | 2.9 | 6.5 | 1.8 | 0.9 | 2.3 | 2.6 | ||
| 2015 | 3.5 | 6.9 | 2.3 | 1.5 | 0.8 | 0.3 | 1.0 | 0.3 | 1.0 | 2.4 | 3.0 | 3.2 | 4.3 | 1.6 | 0.6 | 2.1 | 1.9 | ||
| 2014 | 6.7 | 5.5 | 0.5 | 3.9 | 0.0 | 1.8 | 2.4 | 0.7 | 1.8 | 3.3 | 3.3 | 1.6 | 3.8 | 2.1 | 1.8 | 2.7 | 2.4 | ||
| 2013 | 10.5 | 9.5 | 2.9 | 4.0 | 0.8 | 0.5 | 0.8 | 1.2 | 1.0 | 4.2 | 8.8 | 4.3 | 7.8 | 2.8 | 0.8 | 3.7 | 3.2 | ||
| 2012 | 5.9 | 8.7 | 2.0 | 3.8 | 1.4 | 1.1 | 1.8 | 0.5 | 0.9 | 4.7 | 9.1 | 3.9 | 6.0 | 2.7 | 1.3 | 4.2 | 3.3 | ||
| 2011 | 8.1 | 10.4 | 3.9 | 3.0 | 2.4 | 0.6 | 1.5 | 0.5 | 2.5 | 4.4 | 4.4 | 3.5 | 5.9 | 3.2 | 0.9 | 3.7 | 3.2 | ||
| 2010 | 12.5 | 4.4 | 1.1 | 6.3 | 1.0 | 2.5 | 1.4 | 0.0 | 2.0 | 6.8 | 8.8 | 3.1 | 5.3 | 3.7 | 1.8 | 5.1 | 3.9 | ||
| 2009 | 6.5 | 10.4 | 1.5 | 5.3 | 2.2 | 1.1 | 2.0 | 5.0 | 4.2 | 6.1 | 11.5 | 4.1 | 6.1 | 3.7 | 2.4 | 6.6 | 4.6 | ||
| 2008 | 10.3 | 10.4 | 0.7 | 6.2 | 4.7 | 1.4 | 5.6 | 7.4 | 1.6 | 4.3 | 7.2 | 6.1 | 8.4 | 4.5 | 3.9 | 4.0 | 5.0 | ||
| 2007 | 8.8 | 6.5 | 1.2 | 7.0 | 1.4 | 1.3 | 4.3 | 3.5 | 0.9 | 8.1 | 11.4 | 7.2 | 7.3 | 4.3 | 2.8 | 5.9 | 4.9 | ||
| 2006 | 10.5 | 11.7 | 1.3 | 8.2 | 3.0 | 0.6 | 2.2 | 3.0 | 2.9 | 4.8 | 3.6 | 1.5 | 6.2 | 5.1 | 1.8 | 3.6 | 4.3 | ||
| 2005 | 5.9 | 7.5 | 2.2 | 3.3 | 1.4 | 1.6 | 4.3 | 1.1 | 0.4 | 2.2 | 7.5 | 6.9 | 6.7 | 2.4 | 2.3 | 3.3 | 3.6 | ||
| 2004 | 6.7 | 5.3 | 2.4 | 4.7 | 4.1 | 0.5 | 1.8 | 3.0 | 1.0 | 3.8 | 9.7 | 1.8 | 4.9 | 3.6 | 1.5 | 4.0 | 3.6 | ||
| 2003 | 8.5 | 10.1 | 5.9 | 0.0 | 0.9 | 0.4 | 0.7 | 0.5 | 1.3 | 4.6 | 4.7 | 3.1 | 7.0 | 2.5 | 0.5 | 3.3 | 3.1 | ||
| 2002 | 5.7 | 5.9 | 1.0 | 4.3 | 3.5 | 1.5 | 0.0 | 0.0 | 0.9 | 4.8 | 8.2 | 2.2 | 4.4 | 3.0 | 0.8 | 3.6 | 2.8 | ||
| 2001 | 3.6 | 6.0 | 3.3 | 4.2 | 0.6 | 3.6 | 1.5 | 1.0 | 1.5 | 6.3 | 5.2 | 1.5 | 3.5 | 2.9 | 2.2 | 3.8 | 3.1 | ||
| 2000 | 4.8 | 1.3 | 2.3 | 3.1 | 7.9 | 2.3 | 0.8 | 0.5 | 3.3 | 4.0 | 5.5 | 5.4 | 3.9 | 4.4 | 1.3 | 4.0 | 3.3 | ||
| 1999 | 8.8 | 6.2 | 3.4 | 5.0 | 3.2 | 1.9 | 4.4 | 0.0 | 2.2 | 3.6 | 4.5 | 1.9 | 3.8 | 3.9 | 2.1 | 3.4 | 3.3 | ||
| 1998 | 0.0 | 7.5 | 2.4 | 2.2 | 0.9 | 0.9 | 5.9 | 1.9 | 0.0 | 0.0 | 7.4 | 4.0 | 4.2 | 1.8 | 2.6 | 1.3 | 2.4 | ||
| 1997 | 1.1 | 3.4 | 1.8 | 2.6 | 0.9 | 1.0 | 2.0 | 0.0 | 0.0 | 0.9 | 2.2 | 0.0 | 1.4 | 1.7 | 0.9 | 1.0 | 1.3 | ||
| 1996 | 3.0 | 4.3 | 5.3 | 0.0 | 1.9 | 3.0 | 3.9 | 3.5 | 1.0 | 3.1 | 6.9 | 0.0 | 2.4 | 2.0 | 3.5 | 3.1 | 2.7 | ||
| 1995 | 5.4 | 5.4 | 0.0 | 1.8 | 7.3 | 1.1 | 2.7 | 0.0 | 5.1 | 5.6 | 2.6 | 2.1 | 4.4 | 2.9 | 1.5 | 4.7 | 3.4 | ||
| 1994 | 11.8 | 10.4 | 2.9 | 3.5 | 0.0 | 2.2 | 4.4 | 5.2 | 2.3 | 10.7 | 6.2 | 7.9 | 9.7 | 1.7 | 4.1 | 7.0 | 5.5 | ||
| 1993 | 10.2 | 7.7 | 32.3 | 5.3 | 4.5 | 0.0 | 8.2 | 0.0 | 13.6 | 3.3 | 2.6 | 7.2 | 8.2 | 13.3 | 3.1 | 6.9 | 8.3 | ||
| 1992 | 16.9 | 7.4 | 8.2 | 13.8 | 6.9 | 1.6 | 5.2 | 7.3 | 4.2 | 11.9 | 13.2 | 1.7 | 8.9 | 10.0 | 4.3 | 9.7 | 8.5 | ||
| 1991 | 2.4 | 6.4 | 5.8 | 3.9 | 7.2 | 1.4 | 7.1 | 0.0 | 4.8 | 16.9 | 18.0 | 16.0 | 6.3 | 5.6 | 2.8 | 13.1 | 6.7 | ||
| 1990 | 18.7 | 28.6 | 25.8 | 3.1 | 13.1 | 9.7 | 11.1 | 2.8 | 2.3 | 13.1 | 13.7 | 6.6 | 20.9 | 13.8 | 7.9 | 9.4 | 14.3 | ||
| 1989 | 22.4 | 27.6 | 30.6 | 29.6 | 15.7 | 25.2 | 17.6 | 7.7 | 13.3 | 22.6 | 15.1 | 20.2 | 23.8 | 25.9 | 17.3 | 17.3 | 21.3 | ||
| 1988 | 14.7 | 32.1 | 21.9 | 20.7 | 15.6 | 16.4 | 16.6 | 8.6 | 21.8 | 24.6 | 11.1 | 16.4 | 21.8 | 18.9 | 14.1 | 19.1 | 18.7 | ||
| 1987 | 18.2 | 6.7 | 18.2 | 11.3 | 15.5 | 10.0 | 9.2 | 5.0 | 14.4 | 14.0 | 17.9 | 9.8 | 10.0 | 15.0 | 7.9 | 15.4 | 12.7 | ||
| 1986 | 15.4 | 18.4 | 13.2 | 2.8 | 6.4 | 5.9 | 0.0 | 0.0 | 0.0 | 3.9 | 24.1 | 25.7 | 20.2 | 8.1 | 2.2 | 8.1 | 9.6 | ||
| 1985 | 3.3 | 3.3 | 0.0 | 0.0 | 0.0 | 0.0 | 0.0 | 0.0 | 0.0 | 0.0 | 20.0 | 3.6 | 3.4 | 0.0 | 0.0 | 5.0 | 1.2 | ||
| 1984 | 0.0 | 0.0 | 0.0 | 0.0 | 0.0 | 0.0 | 0.0 | 0.0 | 0.0 | 0.0 | 3.2 | 0.0 | 0.0 | 0.0 | 0.0 | 1.1 | 0.4 | ||
| 1983 | 0.0 | 0.0 | 0.0 | 0.0 | 0.0 | 0.0 | 0.0 | 0.0 | 0.0 | - | 0.0 | 0.0 | 0.0 | 0.0 | 0.0 | 0.0 | 0.0 | ||
| 1982 | - | 0.0 | - | 0.0 | 0.0 | 0.0 | - | 0.0 | - | 0.0 | - | 0.0 | 0.0 | 0.0 | 0.0 | 0.0 | 0.0 | ||
Breeding data
Breeding records by month
Number of breeding records by breeding code and month, 2017 and all years| Breeding code | Jul | Aug | Sep | Oct | Nov | Dec | Jan | Feb | Mar | Apr | May | Jun |
|---|---|---|---|---|---|---|---|---|---|---|---|---|
| 2017 | ||||||||||||
| Breeding (BLA code) | 0 | 0 | 0 | 0 | 0 | 0 | 0 | 0 | 0 | 0 | 0 | 0 |
| Carrying Food | 0 | 0 | 0 | 1 | 1 | 0 | 0 | 0 | 0 | 0 | 0 | 0 |
| Copulating | 0 | 0 | 0 | 0 | 0 | 0 | 0 | 0 | 0 | 0 | 0 | 0 |
| Display | 0 | 0 | 0 | 2 | 0 | 0 | 0 | 0 | 0 | 0 | 0 | 0 |
| Dependent young | 0 | 0 | 0 | 1 | 0 | 2 | 0 | 0 | 0 | 0 | 0 | 0 |
| Faecal sac | 0 | 0 | 0 | 0 | 0 | 0 | 0 | 0 | 0 | 0 | 0 | 0 |
| Inspecting hollow | 0 | 0 | 0 | 0 | 0 | 0 | 0 | 0 | 0 | 0 | 0 | 0 |
| Nest building | 0 | 0 | 0 | 0 | 0 | 0 | 0 | 0 | 0 | 0 | 0 | 0 |
| Nest with eggs | 0 | 0 | 0 | 0 | 0 | 0 | 0 | 0 | 0 | 0 | 0 | 0 |
| Nest with young | 0 | 0 | 0 | 0 | 0 | 0 | 0 | 0 | 0 | 0 | 0 | 0 |
| On/leaving nest | 0 | 0 | 0 | 0 | 0 | 0 | 0 | 0 | 0 | 0 | 0 | 0 |
| All years | ||||||||||||
| Breeding (BLA code) | 0 | 0 | 0 | 1 | 2 | 1 | 1 | 1 | 1 | 0 | 0 | 0 |
| Carrying Food | 0 | 0 | 1 | 14 | 8 | 2 | 2 | 1 | 0 | 0 | 0 | 0 |
| Copulating | 0 | 0 | 0 | 0 | 0 | 0 | 0 | 0 | 0 | 0 | 0 | 0 |
| Display | 0 | 0 | 2 | 3 | 0 | 1 | 0 | 0 | 0 | 0 | 0 | 0 |
| Dependent young | 0 | 0 | 2 | 19 | 11 | 8 | 15 | 5 | 1 | 0 | 0 | 0 |
| Faecal sac | 0 | 0 | 0 | 0 | 0 | 0 | 0 | 0 | 0 | 0 | 0 | 0 |
| Inspecting hollow | 0 | 0 | 0 | 1 | 0 | 0 | 0 | 0 | 0 | 0 | 0 | 0 |
| Nest building | 0 | 5 | 3 | 8 | 1 | 2 | 1 | 0 | 0 | 0 | 0 | 0 |
| Nest with eggs | 0 | 0 | 2 | 6 | 1 | 1 | 0 | 0 | 0 | 0 | 0 | 0 |
| Nest with young | 0 | 0 | 3 | 4 | 2 | 0 | 1 | 0 | 0 | 0 | 0 | 0 |
| On/leaving nest | 0 | 1 | 2 | 3 | 0 | 0 | 0 | 0 | 0 | 0 | 0 | 0 |
Breeding records by year
Average number of breeding records per period by breeding code| Period | Breeding (BLA code) | Carrying Food | Copulating | Display | Dependent young | Faecal sac | Inspecting hollow | Nest building | Nest with eggs | Nest with young | On/leaving nest |
|---|---|---|---|---|---|---|---|---|---|---|---|
| All years | |||||||||||
| All | 0.2 | 0.8 | 0.0 | 0.2 | 1.7 | 0.0 | 0.0 | 0.6 | 0.3 | 0.3 | 0.2 |
| Previous years | |||||||||||
| All previous years | 0.2 | 0.7 | 0.0 | 0.1 | 1.7 | 0.0 | 0.0 | 0.6 | 0.3 | 0.3 | 0.2 |
| Previous 30 years | 0.2 | 0.9 | 0.0 | 0.1 | 1.9 | 0.0 | 0.0 | 0.7 | 0.3 | 0.3 | 0.2 |
| Previous 20 years | 0.3 | 0.7 | 0.0 | 0.2 | 1.1 | 0.0 | 0.0 | 0.5 | 0.0 | 0.0 | 0.3 |
| 10 year groups | |||||||||||
| [2007,2017) | 0.2 | 1.2 | 0.0 | 0.3 | 1.7 | 0.0 | 0.1 | 0.9 | 0.1 | 0.1 | 0.5 |
| [1997,2007) | 0.5 | 0.1 | 0.0 | 0.1 | 0.4 | 0.0 | 0.0 | 0.0 | 0.0 | 0.0 | 0.1 |
| [1987,1997) | 0.0 | 1.3 | 0.0 | 0.0 | 3.7 | 0.0 | 0.0 | 1.1 | 0.9 | 0.7 | 0.0 |
| 5 year groups | |||||||||||
| [2012,2017) | 0.0 | 1.0 | 0.0 | 0.0 | 1.0 | 0.0 | 0.0 | 1.6 | 0.2 | 0.0 | 0.8 |
| [2007,2012) | 0.4 | 1.4 | 0.0 | 0.6 | 2.4 | 0.0 | 0.2 | 0.2 | 0.0 | 0.2 | 0.2 |
| [2002,2007) | 0.4 | 0.2 | 0.0 | 0.0 | 0.4 | 0.0 | 0.0 | 0.0 | 0.0 | 0.0 | 0.0 |
| [1997,2002) | 0.6 | 0.0 | 0.0 | 0.2 | 0.4 | 0.0 | 0.0 | 0.0 | 0.0 | 0.0 | 0.2 |
| [1992,1997) | 0.0 | 0.0 | 0.0 | 0.0 | 0.4 | 0.0 | 0.0 | 0.0 | 0.0 | 0.4 | 0.0 |
| [1987,1992) | 0.0 | 2.6 | 0.0 | 0.0 | 7.0 | 0.0 | 0.0 | 2.2 | 1.8 | 1.0 | 0.0 |
| Year | |||||||||||
| 2017 | 0.0 | 2.0 | 0.0 | 2.0 | 3.0 | 0.0 | 0.0 | 0.0 | 0.0 | 0.0 | 0.0 |
| 2016 | 0.0 | 0.0 | 0.0 | 0.0 | 0.0 | 0.0 | 0.0 | 4.0 | 1.0 | 0.0 | 0.0 |
| 2015 | 0.0 | 0.0 | 0.0 | 0.0 | 3.0 | 0.0 | 0.0 | 1.0 | 0.0 | 0.0 | 4.0 |
| 2014 | 0.0 | 2.0 | 0.0 | 0.0 | 1.0 | 0.0 | 0.0 | 1.0 | 0.0 | 0.0 | 0.0 |
| 2013 | 0.0 | 1.0 | 0.0 | 0.0 | 1.0 | 0.0 | 0.0 | 1.0 | 0.0 | 0.0 | 0.0 |
| 2012 | 0.0 | 2.0 | 0.0 | 0.0 | 0.0 | 0.0 | 0.0 | 1.0 | 0.0 | 0.0 | 0.0 |
| 2011 | 0.0 | 1.0 | 0.0 | 0.0 | 3.0 | 0.0 | 0.0 | 0.0 | 0.0 | 1.0 | 1.0 |
| 2010 | 1.0 | 0.0 | 0.0 | 1.0 | 1.0 | 0.0 | 0.0 | 0.0 | 0.0 | 0.0 | 0.0 |
| 2009 | 0.0 | 0.0 | 0.0 | 0.0 | 3.0 | 0.0 | 1.0 | 0.0 | 0.0 | 0.0 | 0.0 |
| 2008 | 0.0 | 2.0 | 0.0 | 1.0 | 3.0 | 0.0 | 0.0 | 1.0 | 0.0 | 0.0 | 0.0 |
| 2007 | 1.0 | 4.0 | 0.0 | 1.0 | 2.0 | 0.0 | 0.0 | 0.0 | 0.0 | 0.0 | 0.0 |
| 2006 | 1.0 | 0.0 | 0.0 | 0.0 | 1.0 | 0.0 | 0.0 | 0.0 | 0.0 | 0.0 | 0.0 |
| 2005 | 0.0 | 0.0 | 0.0 | 0.0 | 0.0 | 0.0 | 0.0 | 0.0 | 0.0 | 0.0 | 0.0 |
| 2004 | 0.0 | 1.0 | 0.0 | 0.0 | 0.0 | 0.0 | 0.0 | 0.0 | 0.0 | 0.0 | 0.0 |
| 2003 | 0.0 | 0.0 | 0.0 | 0.0 | 0.0 | 0.0 | 0.0 | 0.0 | 0.0 | 0.0 | 0.0 |
| 2002 | 1.0 | 0.0 | 0.0 | 0.0 | 1.0 | 0.0 | 0.0 | 0.0 | 0.0 | 0.0 | 0.0 |
| 2001 | 0.0 | 0.0 | 0.0 | 0.0 | 0.0 | 0.0 | 0.0 | 0.0 | 0.0 | 0.0 | 0.0 |
| 2000 | 1.0 | 0.0 | 0.0 | 0.0 | 0.0 | 0.0 | 0.0 | 0.0 | 0.0 | 0.0 | 0.0 |
| 1999 | 2.0 | 0.0 | 0.0 | 1.0 | 2.0 | 0.0 | 0.0 | 0.0 | 0.0 | 0.0 | 1.0 |
| 1998 | 0.0 | 0.0 | 0.0 | 0.0 | 0.0 | 0.0 | 0.0 | 0.0 | 0.0 | 0.0 | 0.0 |
| 1997 | 0.0 | 0.0 | 0.0 | 0.0 | 0.0 | 0.0 | 0.0 | 0.0 | 0.0 | 0.0 | 0.0 |
| 1996 | 0.0 | 0.0 | 0.0 | 0.0 | 1.0 | 0.0 | 0.0 | 0.0 | 0.0 | 0.0 | 0.0 |
| 1995 | 0.0 | 0.0 | 0.0 | 0.0 | 0.0 | 0.0 | 0.0 | 0.0 | 0.0 | 1.0 | 0.0 |
| 1994 | 0.0 | 0.0 | 0.0 | 0.0 | 1.0 | 0.0 | 0.0 | 0.0 | 0.0 | 1.0 | 0.0 |
| 1993 | 0.0 | 0.0 | 0.0 | 0.0 | 0.0 | 0.0 | 0.0 | 0.0 | 0.0 | 0.0 | 0.0 |
| 1992 | 0.0 | 0.0 | 0.0 | 0.0 | 0.0 | 0.0 | 0.0 | 0.0 | 0.0 | 0.0 | 0.0 |
| 1991 | 0.0 | 0.0 | 0.0 | 0.0 | 2.0 | 0.0 | 0.0 | 0.0 | 0.0 | 1.0 | 0.0 |
| 1990 | 0.0 | 1.0 | 0.0 | 0.0 | 3.0 | 0.0 | 0.0 | 1.0 | 2.0 | 0.0 | 0.0 |
| 1989 | 0.0 | 4.0 | 0.0 | 0.0 | 19.0 | 0.0 | 0.0 | 7.0 | 3.0 | 2.0 | 0.0 |
| 1988 | 0.0 | 4.0 | 0.0 | 0.0 | 7.0 | 0.0 | 0.0 | 3.0 | 1.0 | 1.0 | 0.0 |
| 1987 | 0.0 | 4.0 | 0.0 | 0.0 | 4.0 | 0.0 | 0.0 | 0.0 | 3.0 | 1.0 | 0.0 |
| 1986 | 0.0 | 0.0 | 0.0 | 0.0 | 0.0 | 0.0 | 0.0 | 0.0 | 0.0 | 2.0 | 0.0 |
| 1985 | 0.0 | 0.0 | 0.0 | 0.0 | 0.0 | 0.0 | 0.0 | 0.0 | 0.0 | 0.0 | 0.0 |
| 1984 | 0.0 | 0.0 | 0.0 | 0.0 | 0.0 | 0.0 | 0.0 | 0.0 | 0.0 | 0.0 | 0.0 |
| 1983 | 0.0 | 0.0 | 0.0 | 0.0 | 0.0 | 0.0 | 0.0 | 0.0 | 0.0 | 0.0 | 0.0 |
| 1982 | 0.0 | 0.0 | 0.0 | 0.0 | 0.0 | 0.0 | 0.0 | 0.0 | 0.0 | 0.0 | 0.0 |
Distribution map
Distribution - 2017
This map shows the observed distribution of the Flame Robin for 2017.
The red circles are the grid cells where Flame Robin have been reported.
The transparency of the red circles indicate how many surveys sheets were submitted for that grid cell; the darker the red the more reliable the data. Of the 315 grid cells with reports, 83 had only one sheet; an example is grid number A9.
The size of the circle represents the reporting rate. The maximum reporting rate for Flame Robin was 100.0% (eg grid number A9) and the minimum was 0.1% (eg grid number K13). 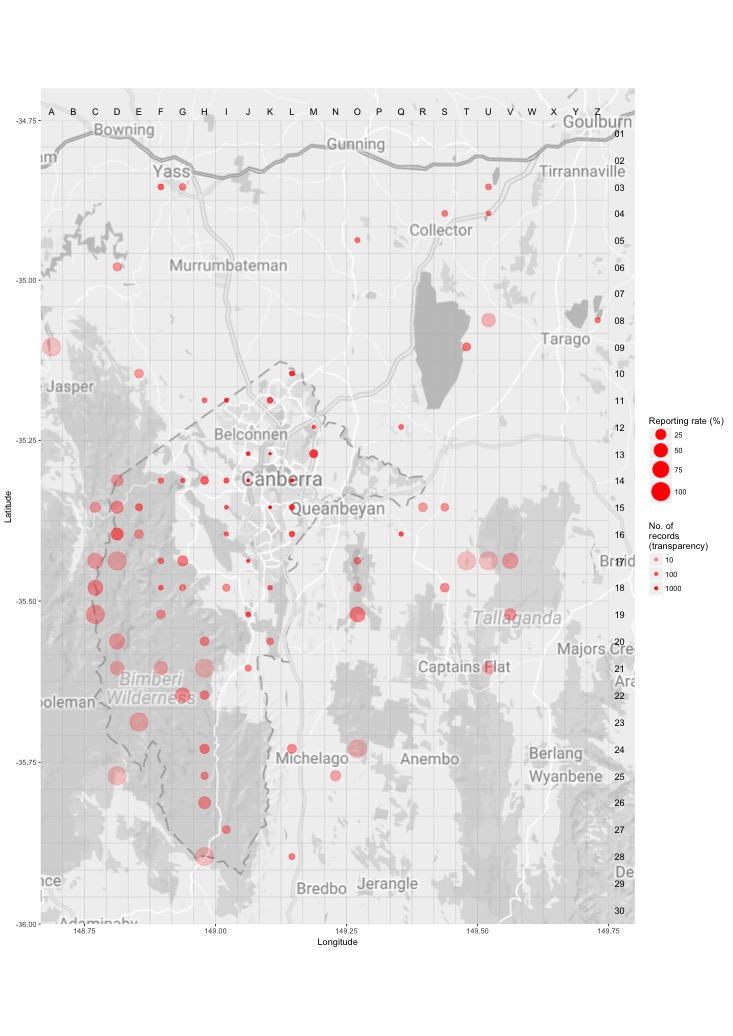
Distribution - all years
This map shows the observed distribution of the Flame Robin for all years.
The red circles are the grid cells where Flame Robin have been reported.
The transparency of the red circles indicate how many surveys sheets were submitted for that grid cell; the darker the red the more reliable the data. Of the 703 grid cells with reports, 55 had only one sheet; an example is grid number F9.
The size of the circle represents the reporting rate. The maximum reporting rate for Flame Robin was 100.0% (eg grid number F9) and the minimum was 0.1% (eg grid number K14). 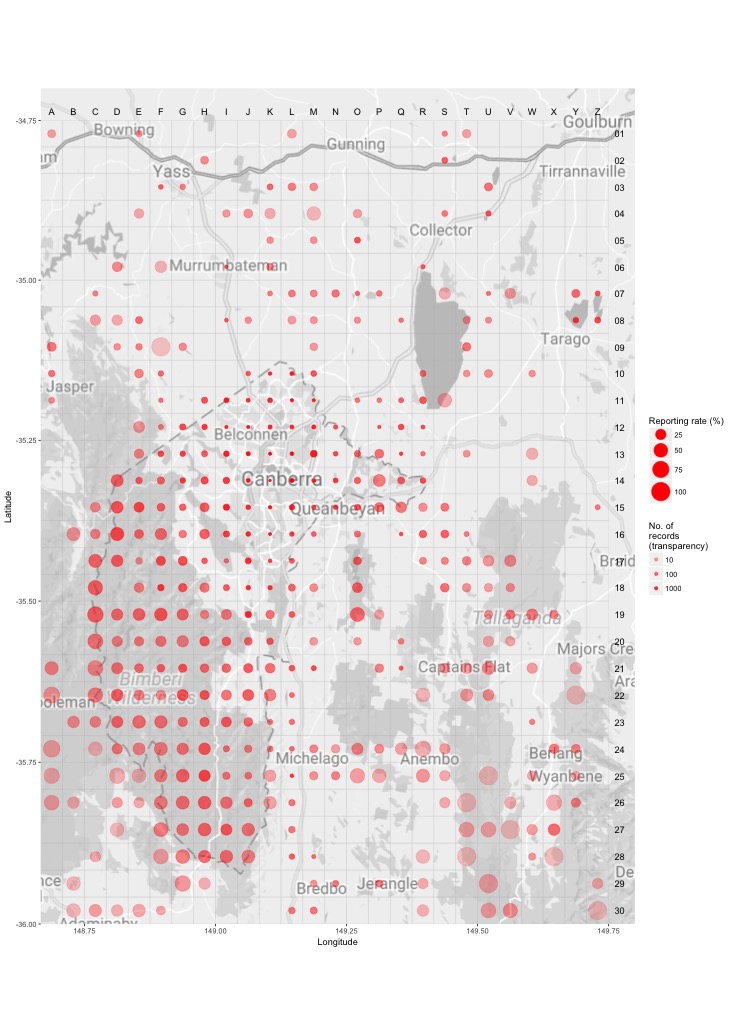
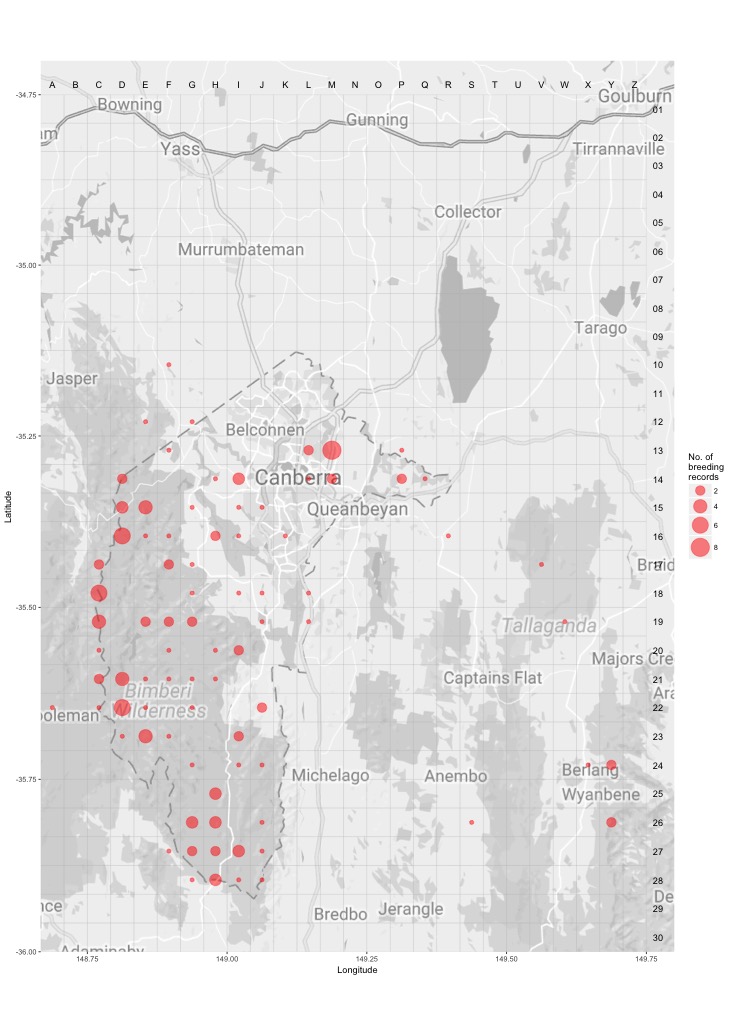
Breeding map
Breeding - 2017
This map shows the breeding distribution of the Flame Robin for 2017.
The red circles are the grid cells where breeding activity for Flame Robin have been reported.
The size of the circle represents the number of reports. 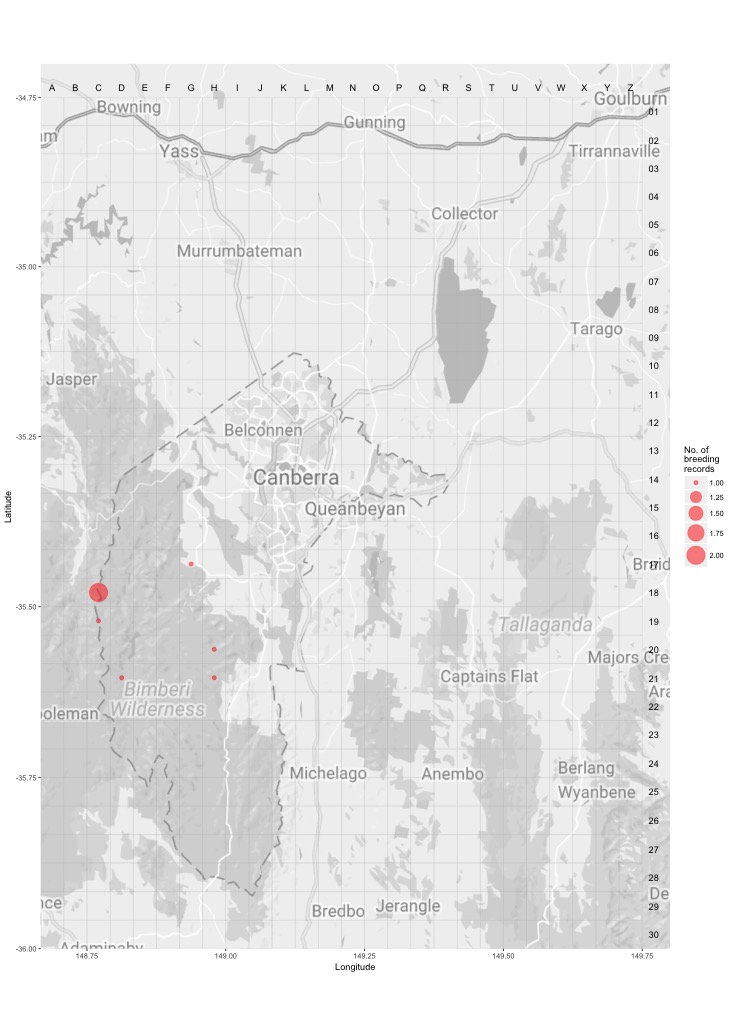
Breeding - all years
This map shows the breeding distribution of the Flame Robin for all years.
The red circles are the grid cells where breeding activity for Flame Robin have been reported.
The size of the circle represents the number of reports.